Physics 208 - Lab 1 - Vibrating Strings
Introduction
Standing Waves
Goals
The goal of this lab is to investigate how various physical properties of a string affect its behavior while undergoing oscillatory motion.
Equipment check
Please make sure your station has all of the following items. If not, check again, then talk to your lab instructor.

- Slotted Mass set
- 12" ruler
- Meter stick
- track
- Wave Oscillator Unit
- Sine wave generator
- Thick white string
- pan
Warm Up Exercise
Here are a warm up questions to get familiar with standing waves on a string.
To Do: One person holds the white stretchy string so that it is just barely taught. Another lab partner plucks the string.
What type of wave is created?
What mode of oscillation results?
If the tension in the string is 10 N, and its linear mass density is 4.3 g/m, what will the frequency of the n = 1 mode be, assuming the string is about 1 meter?
What will happen to the linear mass density if the person holding the string stretches it? Will $\mu$ increase, decrease, or stay the same?
Stretch the string and listen to the frequency of the string as you do so. What do you observe (or hear) happening to the frequency
A little simulation
Here is a sim showing the components of standing wave. Adjust the slider to see the effects on the standing wave.
Experiment 1
Verify the relation between number of antinodes and the wavelength of the standing wave: $$\frac{2L}{n} = \lambda$$ To do this, you'll need to take several measurements in which you change only the frequency of oscillation, and the build a table of data that has the number of antinodes visible ($n$) and the measured length of the wave. For example, the fundamental harmonic, $n = 1$, has a wavelength of $2L$. In your lab notebook, make a table of data like this:
| n | $\lambda$ | $f$ |
|---|---|---|
| 1 | ||
| 2 | ||
| $\vdots$ | ||
| 5 |

The basic setup of a vibrating string.
- Set up the string as shown in the figure.
- Place 2x100 gram weights on the slotted mass hanger.
- Adjust the frequency knobs until you see the fundamental resonance. Record the wavelength and the frequency.
- Repeat for up to $n=5$.
After you have this data, make a plot in excel showing the relation between $1/n$ (vertical axis) and $\lambda$ (horizontal axis). Since the relation between these parameters is: $$ \frac{1}{n} = \frac{1}{2L}\lambda$$ The slope of the resulting graph should given by $\frac{1}{2L}$. Confirm that this is the case.
Experiment 2
As you discovered in Physics 207 labs, measuring $g$, the acceleration due to gravity is not very easy, at least if you are hoping to get a very precise measurement. Just timing a falling ball by hand doesn't give a very good measurement. This lab will attempt to measure little g again, but instead by using the oscillations of a standing wave set up on a string under tension.
Here is the basic setup. There is a string held in place between two points a distance $L$ apart. There is a mass hanging from one end, putting a tension on the string.

You will need to figure out how to make a measurement of little $g$ using this setup.
As with any experiment, there are some things you change, and some things you cannot. Take a moment to think of the relevant variables you can change, and those that are you cannot. For example, the length of the string is set by the experimental setup and cannot be changed.
Here are some basic relations from the study of waves that might be useful:
1. The speed of a traveling wave is given by: $$v = \sqrt{\frac{T}{\mu}}$$ where $T$ is the tension in the string and $\mu$ is the linear density (mass/length) of the string.
2. The tension is equal to the amount of gravitational force acting on the masses attached to the string.
3. The relationship between wavelength, frequency, and speed is given by: $$ v = \lambda f$$
And some other experimental things.
There is a sensitive scale in the lab you can use to measure the mass of the string if you want to.
You will want to have several measurements for this experiment. I.e. more than one data point. A successful experiment will be able to produce a graph with two quantities being compared. One will have little $g$ in it. The slope of the line with then be the experimentally derived value of little $g$. See here for more info on curve fitting.
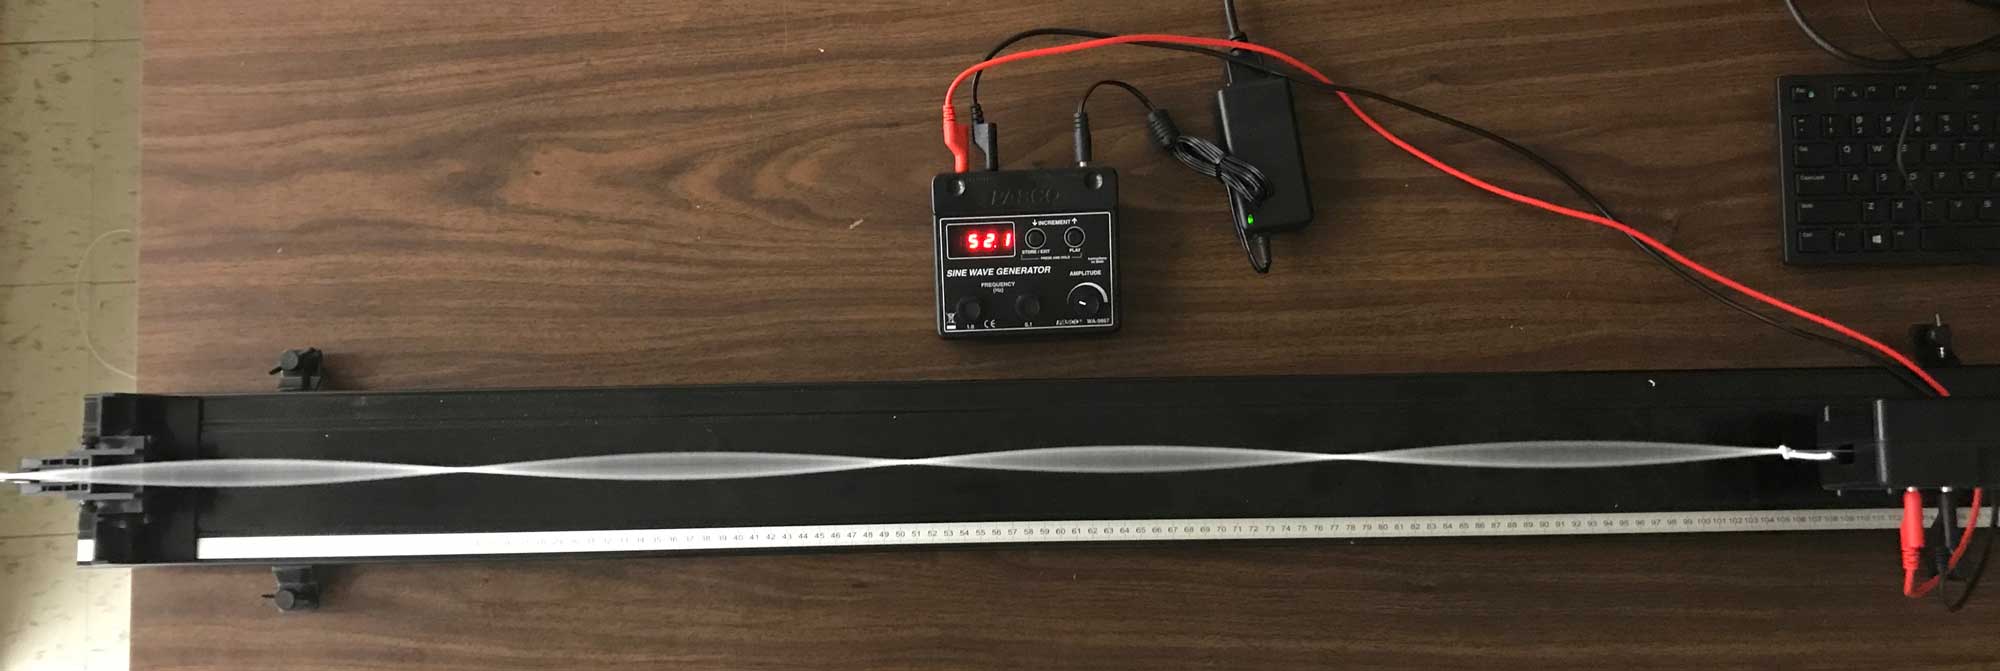
Here is an image of a nice standing wave on the string with 4 antinodes visible. This tells us it oscillating in the n = 4 mode.
Report Structure
This lab involves the creation of your own experiment. (No cookbook here!) Thus for the lab report you will need to describe this experiment in detail following the general structure of a lab report.
Some things to think about:
What aspects of the experiment would you refine to make a better measurement?