Physics 103 - Lab 4 - Simple Harmonic Oscillators
Introduction
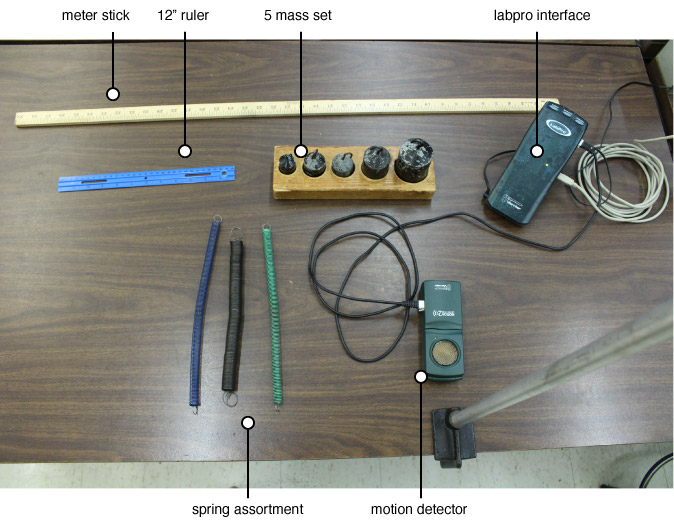
In this lab you will study the simple harmonic motion of a mass hanging from a spring using a motion detector. The overall theme is to experimental verify some of the basic relationships that govern the simple harmonic motion of a mass on a spring.
Here is a Logger Pro file you can download and use. You should see three graphs on the right half of the screen. If there are less than three go to the “insert” menu and select “graph.” To arrange the graphs neatly, in a stack, go to the “page” menu and select “autoarrange.” Graphs may be removed by clicking on them and hitting the delete key.
Clicking on any number on the ordinate or abcissa scales allows you to change the range. Pressing the mouse pointer when it is on the accept data button activates the gathering of data. Note that there is roughly a two-second delay between the time that the accept data button is pushed and the time it starts collecting data.
Make a sketch of the experimental setup to have in your report. The mass which is attached to the spring is free to oscillate up and down. The motion detector feeds information on the mass’ motion into the laptop where plots of the mass’s position and velocity are made in real time.
Predictions
Assume the mass and spring are hooked up as shown above and the mass is pulled down and released, setting it into motion at t = 0. On a piece of paper sketch your prediction for the position vs. time (d vs. t), velocity vs. time (v vs. t) and acceleration vs. time (a vs. t) graphs for oscillation that lasts for 2 periods.
Equilibrium
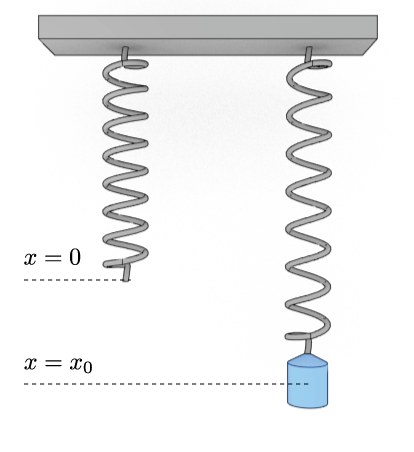
Hang a 1.000 kg mass from the spring such that the mass is not moving. The spring will stretch by an amount $x_0$ as shown. The force of the spring depends on the spring constant k and the length $x_0$ , it is given by: $$F_\textrm{spring} = -k x$$
Assuming the mass is at rest at the bottom, draw the free body diagram of the mass. Label each of the forces. Use this drawing in conjunction with the sum of forces to calculate the spring constant $k$. Show how you arrived at your answer.
**We will call the position of the mass when it remains at rest is the equilibrium position. Note that the net force on the mass at equilibrium position is 0.**
Initial Observations
First, hang 1.000 kg from the spring. Set Logger Pro to plot position vs. time, velocity vs. time, and acceleration vs. time. Collect a set of data with the mass at rest. Write down the equilibrium position of the mass. Pull the mass down a few centimeters from the equilibrium position and release it to start motion. Collect a set of data while the mass is moving.
Using your acquired data: answer the following questions and include them in your report.
Report Questions
- Describe how the mass moves relative to the equilibrium position.
- Calculate the maximum velocity from the position vs. time graph. Show your calculations. Compare with the value from the velocity time graph.
- At what position is the velocity a maximum?
- Calculate the minimum velocity from the position vs. time graph. Show your calculations. Compare with the value from the velocity time graph.
- At what position is the velocity a minimum?
- Calculate the maximum acceleration from the velocity vs. time graph. Show your calculations. Compare with the value from the acceleration vs. time graph.
- At what position is the acceleration a maximum?
- Calculate the minimum acceleration from the velocity vs. time graph. Show your calculations. Compare with the value from the acceleration vs. time graph.
- At what position is the acceleration a minimum?
- Compare your position, velocity and acceleration graphs with your predictions on page 1. Resolve any discrepancies.
Oscillation Parameters
Predict if/how the period of oscillation will change when the mass is changed and explain why.
Predict if/how the period of oscillation will change when the initial amplitude is changed. Explain why.
Experiment:
Devise experiments to see how the Period depends on Mass and Amplitude. Your results must include the following graphs:
- Period as a function of Mass
- Period as a function of the square root of the Mass
- Period as a function of Amplitude
Report Questions
Use the plots mentioned above $[ T(m), T(\sqrt{m}), T(A)]$ to validate the relations between the period and the mass or amplitude.
Energy Conservation
Collect a set of position vs. time, velocity vs. time and acceleration vs. time data for an oscillating mass of 1.000 kg.
Calculation: Test conservation of energy by using your acquired data to calculate and compare the total energy of the system at 2 point along the mass’s path. Take the first point at to be at the highest position of the mass and the second point when the mass is at the equilibrium position.
Report Questions
Discuss your test of the conservation of energy for this system. If you found that energy is not conserved, make a case for where you think the energy went.