Physics 203 - Lab 1 - Measurements
Introduction
Any physical science requires measurement. This lab will involve making several measurements of the fundamental units of length, mass, and time. There is no traditional 'hypothesis - test - analysis' methodology, but just a series of exercises to help you get used to making scientific measurements.
Also, in physics, we often use functional relationship to understand how one quantity varies as a function of another. For example, if you apply a constant force to an object, the acceleration of the object will be directly proportional to this force: $a \propto F$. This is an example of a linear relationship. This lab will explore several other relationships in the context of physical measurements. Below are several different functional relationships between $x$ and $y$ which are likely to come up in physics.

As you do this lab (as well as all the others this semester), you be asked to enter certain data points into the computer. This is meant to serve as a partial record of the lab activities. You should also keep more thorough and detailed notes in a notebook to refer to when writing your lab report. In professional science and other lab settings, there is often a mix of digital and analog data - it's good practice to get used to dealing with both.
Sometimes, you'll create data files during the lab, either in Excel or perhaps another format. You can either email those to yourselves or use a thumb drive to make sure you have access to the data later on.
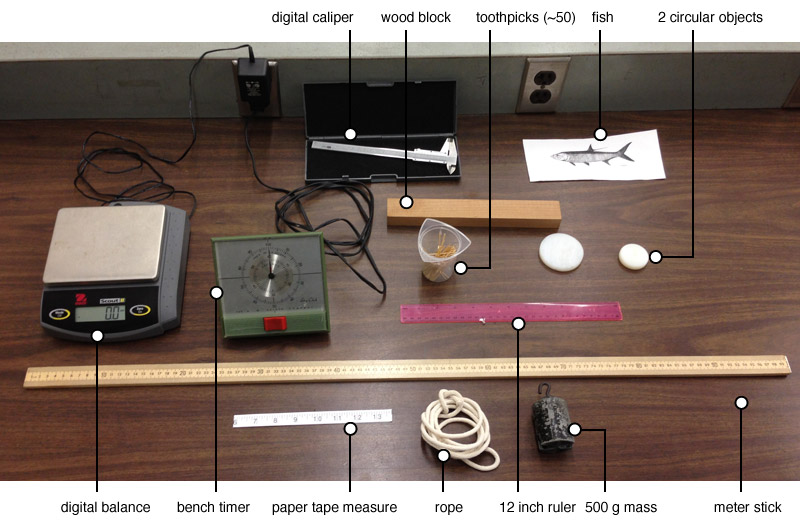
Equipment check
Please make sure your station has all of the following items. If not, check again, then talk to your lab instructor.
Measurement 1a
As a warm up to get used to measuring things, use the paper tape measure to measure the circumference of your head, in centimeters. Enter this value in the box below. (Perform both measurements on the same person.)
Next, use the stop watch on the bench to measure the heart rate of the person whose head was measured. You can express the measurment in beats per minute.
Measurement 1b
Now, take the measurements of one person's wrist and neck circumferences using the paper tape measure.
Great. We'll come back to these measurements at the end of the lab.
Circles
The first type of functional relationship we'll investigate is a linear relationship. Such a relationship is usually given by a function that looks like $y = f(x) = m x$. Here $m$ is a constant value, and $x$ is our independent variable, and $y$ is the dependent variable.
A very well known linear relationship is that between the circumference, $c$ of a circle and the diameter, $d$, of that circle. The relation, in a mathematical formula is $c = \pi d$, where the symbol $\pi$ represents the linear coefficient term. The following experiments will attempt to measure $\pi$ using several different methods. Each method will involve several measurements of diameters and circumferences.
Exercise
Measurement 2
Use the tape measure to measure the circumference and the diameter of the circular objects on the table. Record your data in a table like the following.
| Object # | Diameter | Circumference |
|---|---|---|
| 1 | ||
| 2 | ||
| 3 |
Then, manually input these values in Excel. Plot the results with a scatter plot and use the 'trendline' feature to establish a slope for this line. The slope should be your first estimate for $\pi$. Enter it in the box below. Here is a link to an Excel template to get you started. **Note, for future labs you will be expected to know how to set up your own excel graphs and analysis. Take some time between now and then to play around with it.**
Measurement 3
Use these toothpicks to estimate $\pi$.
Try making a shape that's approximately circular. Count how many sticks are in the circumference. Then make a diameter with the same sticks. In this case below, we can see that there are 8 sticks on the circumference, and about 2.5 across the diameter. This makes a ratio of $c/d$ equal to 8/2.5 = 3.2.

Measurement 4
Use google maps to estimate the value of Pi. Find a circular feature and measure its circumference and diameter using the maps interface. (Here's how if you're not familiar) In your lab notebook, indicate which features you've recorded and the measurements of circumference and diameter in a table similar to the previous one. Find the value of $\pi$ based on this measurement. **If the internet is too slow in the lab to do this experiment, it may be done later by the students individually.**
Goto Google MapsYou'll need to find either a geological or man-made feature that is large and circular
Usually, when a meteor strikes the earth, it leaves a large crater behind that is more or less circular. Can you find any of those? Also, there are very large circular tanks near many cities for storing things. Take a look near Newark perhaps.
Ok. If you haven't found any circles yet, here are a bunch.
Painted circles at Newark Airport
Report Questions
Discuss the limitations of these methods for calculating $\pi$. Which method was the best? The worst? Are there improvements to be made?
Uncertainty in Measurements
From the above measurements, you've probably discovered that your value of $\pi$ differs from the accepted value of 3.14159... It might be a little higher, or a little lower depending on how good your measurement was. This degree of 'goodness' will be determined by many factors: the quality of the instruments, their inherent resolution, your skill as an experimentalist, etc. We can quantify this 'goodness' by considering the error associated with the measurement. In science, error does not mean a mistake, or mess-up, or incorrect answer, as it does in common speech. In the science measurements, error specifically refers to how confident we are in our measurement. The bigger the error, the less confident we can be about our measurements. Our measurement can still be correct, we just are less certain about it.
We'll consider the error associated with a simple length measurement first. Below is a picture of a pencil being measured by a ruler.

We can see that the pencil is greater than 9 centimeters long, but less than 9.5. Because of the spacing of the marks on the ruler, we can only be so certain about this measurement. We can of course see that the pencil is kinda close to 9.25 centimeters. Thus, as a general rule, we'll say that the uncertainty in this measurement is equal to one half of the smallest spacing on the ruler, which, on this ruler is 0.5 centimeters.
$$\delta L = \frac{0.5}{2} = .25 \;\textrm{cm}$$
Thus, the measurement we'll report for this pencil is: $9.25 \pm 0.25 $ cm.
Measurement 4: Measure the fish.
On the bench is a paper fish. Use the ruler to measure the length of the fish, and report your result, with the uncertainty in your measurement in the space below. (Report this measurement in centimeters.)
Experiment: Density of Wood
On the bench is a block of wood. The type of tree it came from is unknown. Your task is to attempt to identify the piece by measuring the density of the wood.
Using the vernier caliper when possible, and the meter stick, measure the three dimensions of the wood. Record these values and determine the density. Find the mass of the block using the digital scale. The density, $\rho$, is the ratio of the mass to the volume of the block. $$\rho = \frac{m}{V}$$
Report your measured density of this piece of wood (in g/cm3).
Report Questions
Determine the uncertainty of your density measurement. This will involve some algebraic calculation. You can find some pointers here: Info about error analysis. Next, find an online database that you can use to lookup the density of various woods. Try to match your piece of wood with a known tree. Discuss whether you can be certain of your identification.
Experiment: Time of oscillations
Although you haven't studied them yet in class, let's take a look at a basic pendulum. We're going to measure its period of oscillation - that is the time it takes to swing back and forth once.
Start by making a long pendulum about 1.5 meter in length. Record the exact length of the string from the fixed point of rotation to the center of the mass on the free end.
Let the mass swing back and forth through a small angle. (Meaning, don't swing the pendulum too much.)
Record the time it takes for one full swing (i.e. back and forth).
Repeat this measurement for 5 different lengths, between 10 cm and 1.5 meter.
Create a plot in excel that shows the time for one oscillation as a function of the length of the string
Report Questions
Based only on your experimental data, can you say how the time for one swing relates to the length of the pendulum? Is there a clear functional dependence? What could you do to make the experiment better?
Measurement Analysis
Let's return to the first measurements we did. Click the 'refresh data' button below. A table should appear that shows the other lab bench's results. Copy this table into excel using the Copy button below. Then plot the data points in a scatter plot, with head size on the vertical axis, and heartbeat time on the horizontal axis. Do the same with the measurements of wrist and neck circumferences.
Report Questions
Using the table of data that the whole lab acquired, can you say if there is any correlation between the circumference of someone's head and the time between heartbeats? Would you expect there to be one?
What about the measurements of the wrist and neck circumferences? Do any patterns emerge based on that data?