Physics 204 - Experiment 7 - Spectroscopy
Introduction
This experiment will introduce you to one of the most powerful tools from physics: Optical Spectroscopy. It has applications in nearly every field of science, from medicine to engineering to interior design!
Spectroscopy is generally meant to describe the process of obtaining a spectrum from a certain signal or physical process. A spectrum is a graph that shows the intensity of the signal at different wavelengths, or energies.
An example: If you remember the first lab of the semester in which you recorded the sounds from a tuning fork and other sound sources, we could have made a spectrum for the sounds that we recorded. The tuning fork, which created a very pure tone of a certain wavelength, would have had a spectrum that looks like the following graph:

An example spectrum showing intensity vs. frequency for a sound from a tuning fork.
The important feature to notice is the sharp peak in the graph around 0.440 kHz (440 Hz). This corresponds to the frequency of sound emitted by the particular tuning fork. If we looked at the spectra of different, more complicated sounds, we would expect graphs with more peaks, or broad curves.
Goals
The Goal of this lab are to learn how to acquire the spectrum of a light source using a spectrometer and some scientific software, and to understand the graphs in relation to fundamental physics. The physics contained in the lab is not too involved, since part of the goal is to try to figure out an unfamiliar software application and data acquisition process (a task you might be confronted with in a lab later on or in some professional setting.)
Equipment check
Please make sure your station has all of the following items. If not, check again, then talk to your lab instructor.

- Spectrometer
- Helium and Hydrogen Discharge Tubes
- Gas Tube Holder Power supply
- Mercury Lamp
- Fiber Optic collector & stand
Physics Background
The physical system we will investigate is a dilute (low-pressure) gas with an applied voltage which excites the gas and creates a light emission. Neon lights and other types of lamps operate using similar setups. When the voltage is applied to the gas, it will excite some of the electrons in the atoms. When the excited electrons loose some energy and fall back to an un-excited state, a photon will be emitted - this is what creates the visible light. By measuring the color (i.e. wavelength or frequency) of the light we can understand the underlying physics.

The Bohr Model for explaining emission of photons
We'll have to understand a how atoms are put together. We'll use the Bohr Model of an atom, which while not entirely correct according to modern physics, is good enough to understand some of the phenomena we will see in the lab today. Most important is the light that can be emitted from an atom, which we will measure. In a basic atom, we can consider the electrons to be in 'orbits' around the nucleus of the atom. The nature of the orbits is very different than the orbits of planets around the sun, however, the two systems share some conceptual building blocks. In the case of the Bohr Model, one difference is that the higher energy levels of the electrons are the orbits further away from the nucleus. Another important feature is that the orbits only occur at select energy levels. The implications of this are that when an electron moves from a higher energy level to a lower energy level, it will have to release a photon with energy equal to the difference between the two energy levels of the atom.
The spectrometer (the blue box on the lab bench) is used to record how much of each color photon is emitted by the light source. Is uses principles from wave optics to separate the light and then counts the number of photons from each color. The software will display this information as a graph, or spectrum.
Warmup exercise
Collect the spectrum from the Mercury Lamp
Collecting light from the Mercury (Hg) lamp
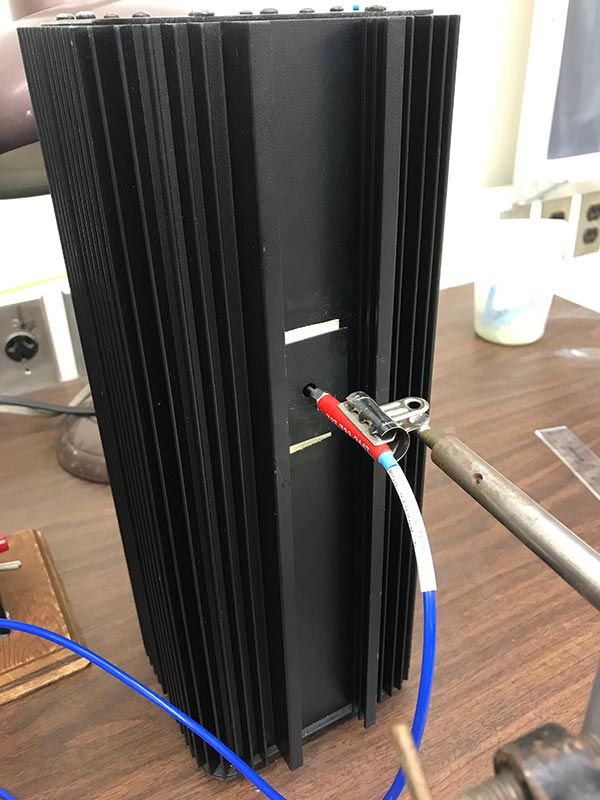
To get started, we'll use the Mercury Vapor Lamp and collect its emission spectrum. Position the lamp so the end of the fiber optic collector is directly in front of the little hole in the front, as shown in the picture. You can turn on the lamp using the switch in the back. You should see a little blue glow coming from the hole in the front.
Start up the OceanView application which should be on the PC desktop.
Choose the Quick View option from the welcome screen.
If your equipment is setup correctly, you should see a spectrum shown in the graph area of the application. If the collector cable is placed properly, this graph should have several peaks that stick out above the background.
After you can see the spectrum on the graph, find the icon on the top bar that will enable you to Copy the data. Click this icon to copy your data, and then open up Excel and past the data into a new worksheet. You should see two columns: the first column is the value of the wavelength of light being recorded (in nanometers) and the second column is the intensity (or counts) at that wavelength.
Make an x-y scatter plot of the two columns to create a spectrum in Excel of the spectrum from the Mercury Vapor lamp.
Do not proceed with the lab until you can do these basic steps, or else you will likely find the remaining part difficult.
Experiment 1: Measure the spectrum of Helium
**Attention! READ THIS**
The gas discharge tube used in this experiment should only be left on for about 30 seconds. They are not meant to be left on for the duration of the entire experiment. So, when doing the steps below, make sure everything is set up before turning on the power supply and exciting the gas.
Also, the glass tubes are very fragile. Please handle them carefully and try not to break any of them.
Follow the instructions to obtain the spectrum of the Helium Discharge tube.
- Put the He discharge tube in the tube holder/power supply.
- Set up the spectrometer and cable to measure the light emitted from the tube.
- Turn on the power supply and make sure the tube is glowing.
- Adjust the collector so that you get a good spectrum.
- Press the pause button to pause the data acquisition.
- Turn off the power to the tube.
Identify on the spectrum, by eye, the highest (i.e. most pronounced) peak.
- Now, copy the spectrum data using the icon on the top menu bar.
- Open Excel and paste the data into a new worksheet.
- Plot the data using an X-Y scatter plot.
- You should be able to obtain something similar to the example shown below.

Example Excel Plot of the spectrum from the Helium Tube.
To Include in your report
You'll want to save your Excel files and either send them to yourself, or copy them to a USB drive, since you'll need them to make your lab report.
- Make a nice plot of the Helium emission spectrum.
- Identify the main peaks (4-6 different ones) of the Helium emission spectrum.
Experiment 2: Hydrogen Line

Two of the Balmer Series transitions shown schematically for a Hydrogen atom.
Now, making sure you've already turned off the power supply, remove the He tube, and insert a Hydrogen Gas Tube. We can understand the colors emitted by Hydrogen gas by using some basic physics. The figure shows a basic view of the Hydrogen atom. When an electron falls from the 3rd energy level to the 2nd, it will emit a photon of a certain wavelength. (It happens to be the color red - labeled by Hα in the diagram) If it falls from the 4th to the 3rd, it will emit a different color (blue-greenish - and labeled by Hβ in the diagram). These two transitions make up part of a larger sequence called the Balmer Series. The wavelengths of the various Balmer series transitions are determined by the following equation: $$ \frac{1}{\lambda} = R \left(\frac{1}{2^2}-\frac{1}{n^2}\right) $$ Here, $\lambda$ is the wavelength of the light, $R$ is the Rydberg Constant (1.097 $\times 10^7$ m-1), and $n$ refers to the starting energy level. So, if you wanted to calculate what color of light would be released when an electron fall from the 3rd to the 2nd energy level, you could use the equation as follows: $$ \frac{1}{\lambda} = 1.097 \times 10^{7} \; \textrm{m}^{-1}\; \left(\frac{1}{2^2}-\frac{1}{3^2}\right) $$ Do this calculation and enter your predicted value of $\lambda$ for the 3→2 transition in the space below:
Now, repeat the same steps as you did before to record the spectrum for the Hydrogen discharge tube.
Copy the data into Excel as you did above.
You'll want to save your Excel files and either send them to youself, or copy them to a USB drive, since you'll need them to make your lab report.
- Include a graph of the Hydrogen Spectrum in your report.
- Solve the Balmer series equation for up to n = 6.
- Identify the prominent peaks in your graph and confirm that your recorded spectrum matches the expected wavelengths for the Balmer Series.