Physics 207 - Lab 2 - Vectors
Introduction
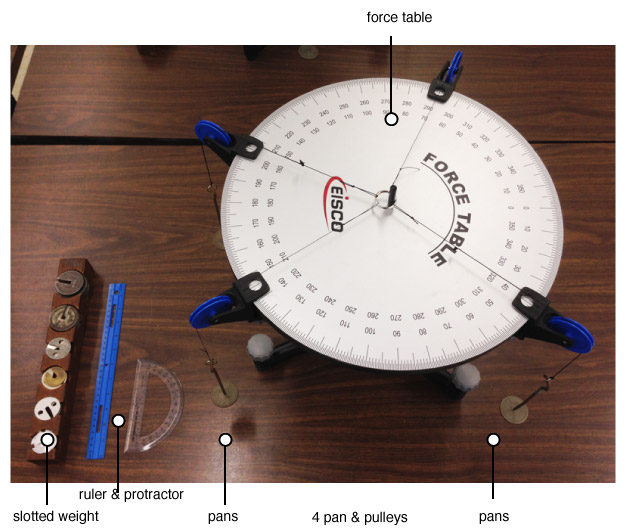
Force Tables
The Force Table allows us to manipulate and measure the effects of vector quantities.
Goals
The object of this lab is to gain a thorough understanding of vector addition. This is accomplished by using the force tables to establish equilibrium for a particle, and correlate this equilibrium condition with the math of vector addition. Two methods of vector addition are discussed: graphical and analytical.
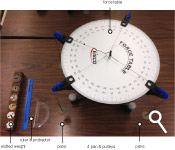
Equipment check
Please make sure your station has all of the following items. If not, check again, then talk to your lab instructor.
Intro to Vectors
Physical quantities that require both a magnitude and direction for their description are vector quantities. A great example of a vector quantity is the wind velocity. Since the wind can blow in a direction, and with a certain speed, we will need to use both a magnitude and a direction to describe this physical quantity.
Adding Vectors
Vectors must be added by special rules that take both parts of the description into account.
Below are two blue vectors, and the vector sum, a dashed black line. Try manipulating the blue vectors and observing what happens to the sum.
About the Force Table
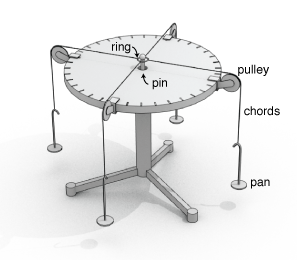
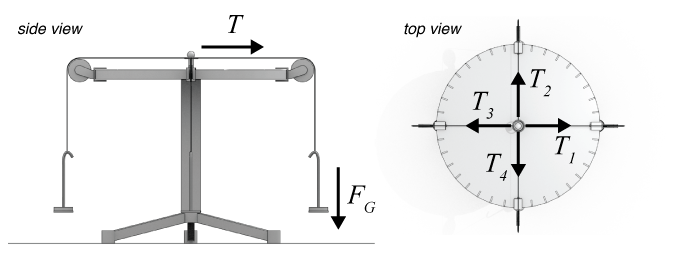
Let's understand exactly how the force table works. A mass is placed in each pan (each pan has a mass of 50g). This mass experiences a force due to gravity given by its mass times $g$ . This force is acting in the vertical direction. In order to redirect the force to act in a horizontal direction (i.e parallel to the surface of the table), chords and pulleys are used. Thus, the tensions from the chords on the ring at the center are equal in magnitude to the force due to gravity on the pan + mass: $$T_1 = m_1 g$$ Attaching several pan/pulley systems to the table allows us to pull on the ring with different tensions in different directions.
What will the tension be, in Newtons, if a 20 gram mass is attached to the 50g tray?
Instructions for use:
- The central ring has spokes that connect the inner and outer edges. When connecting the cords be sure that the hooks have not snagged on a spoke. In that case the cord will not be radial. Also whenever you change a pulley position, check that the cord is still radial.
- Be sure that when you position a pulley, that both edges of the clamp arc snugly against the edge of the force table. Check that the cord is on the pulley.
- There are two tests for equilibrium.
- The first test is to move the pin up and down and observe the ring. If it moves with the pin, the system is NOT in equilibrium and forces need to be adjusted.
- The second test is to remove the pin. However, this should be done in two stages. First just lift it but hold it in the ring to prevent large motions. If there is no motion, remove it completely. If the ring remains centered then the system is in equilibrium.
Exp. 1: Sensitivity of the instrument
Let's measure how precise the force tables are.
- Arrange two pulley systems, Pan 1 at 0° and Pan 2 at 180°.
- In Pan 1, place 50 grams. In Pan 2, also place 50 grams.
- Now, in Pan 2 add 1 gram and check for equilibrium. It's most likely still in equilibrium, right?
- Find the maximum mass you can place in pan 2 and still maintain experimental equilibrium.
Record this value below. This is the sensitivity to weight of the force table.
Report Questions
What factors could contribute to this sensitivity?
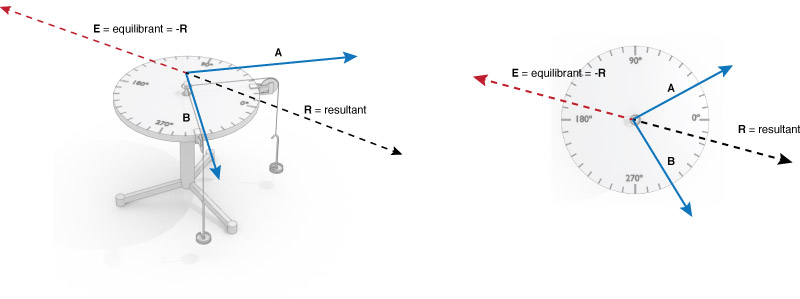
Resultant Vs. Equilibrant
A point to be aware of is that the force needed to balance the system is not the resultant of the weights, but the negative of that vector, also called the equilibrant.
Response:
If the resultant of 2 mass/tray systems points in a direction 234° measured counter-clock-wise (CCW) from the 0° line, in what direction should the equilibrant point?
Experiment 2: Symmetric Arrangement
- Using the number generator below, pick two initial masses and directions.
- Set up two pans and mass systems based on these values.
- Experimentally balance the system. (i.e. without performing any math or analytical operations, find a third pan/mass system that will balance the first two.)
Use the simulated force table below to predict how much mass you should need and compare this to the value you found experimentally. Make sure to include the mass of the pans in when setting up the forces. (You can use $g \approx 10 m/s^2$ for this)
By how many grams was your experiment different from this simulation?
Report Questions
Report the difference between what you've experimentally measured and what the simulation predicted. Are they within the expected sensitivity of the instrument?
Exp. 3: Find a function
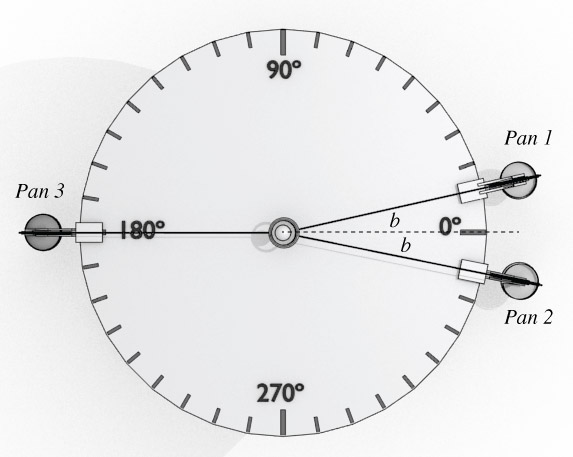
Set up the table at shown. Place 50 grams in pans 1 and 2. Make both angles $b$ equal to 5 degrees.
- Experimentally determine the mass needed to hang from pan 3 to put the system into equilibrium
- Repeat the measurement, changing the angles $b$ each time, in 5° increments, until you reach 80°. (Change the positions of both Pans 1 and 2 each time)
- Compile the results in a table like this.
| Angle | Mass of Pan 3 system |
|---|---|
| 5° | $P_3$ mass |
| 10° | $P_3$ mass |
| ⋮ | ⋮ |
| 80° | $P_3$ mass |
We would expect there to be some mathematical relation between the angle $b$, the mass of $P_1$ and $P_2$, and the mass of $P_3$ needed to balance the system. Using some basic trigonometry, determine an equation that we can use to predict the mass of $P_3$ as a function of the angle $b$, and the mass of $P_1 + P_2$ (considered a constant equal to 200g). It should be something of the form $P_3 = C \cos(b)$, where $C$ is a constant.
In the box below, enter the formula you have found that will predict the mass of Pan 3.
Report Questions
On one graph plot the experimental data from your table along with the analytical prediction of the function you found. Do they follow the same trend?
Your plots should like a section of a cosine function. We can make the data a little easier to work with by plotting the mass as function of the $\cos(b)$ instead. Plot the results (both experimental and anlytical) with the mass of $P_3$ on the vertical axis, and the $\cos(b)$ on the horizontal axis. This should be a linear line:
$$\textrm{if } h(x) = \cos(x) \; \textrm{and}\; f(x) = C \cos(x)$$ $$\Downarrow$$ $$f(x) = C \times h(x) \; \textrm{a linear function}$$Find the slope of your linear data and compare it to what the slope should be from your analytical equation. Does it differ from the analytically derived slope by less than the uncertainty? There are more details about this process here.
Vector Components
Our mathematical framework for dealing with multiple vectors involves using vector components. If we have an x-y coordinate axis, any vector on this axis can be decomposed into its x and y components. The simulation below shows one vector decomposed into its x and y components.
Q: Components
What angle (measured counterclockwise from the x axis) would a vector $\overrightarrow{A}$ need to have so that the magnitude of the x component was equal to twice the magnitude of the y component?
What angle (measured counterclockwise from the x axis) would a vector $\overrightarrow{A}$ need to have so that the magnitude of the y component was equal to half the magnitude of the original vector?
We'll need vector components to do more complicated calculations as the next section shows.
Multiple Forces
Exp. 4: Return to the Force Table
Now let's apply these concepts to the force table. If we have 3 known forces acting, we should be able to analytically predict a fourth force to add so that the system is in equilibrium, i.e. $F_\textrm{net} = 0$.
Press the blue button below to generate 3 sets of random masses and directions
Vector $\overrightarrow{A}$
Vector $\overrightarrow{B}$
Vector $\overrightarrow{C}$
Now, use component algebra to calculate a forth vector, $\overrightarrow{D}$, that when added to the system will result in equilibrium
The Equation you are essentially trying to solve is: $\overrightarrow{A}+\overrightarrow{B}+\overrightarrow{C}+\overrightarrow{D}=0$
Once you have arrived an answer, enter the components of the vector in the boxes below
Use trig to convert your answer back to a magnitude and degree format. Add all four mass/pan systems (3 from the above, the fourth from your prediction) to the table, and verify that the prediction does indeed balance the system.
Report Questions
Give the details of this calculation and compare your analytical results with the the experimental results.
Draw a vector diagram that shows the table arrangement.