Little g lab Report
This report should adhere to a more formal lab report structure. You can see what that entails here.
Report Question 1
Why is this method not very good? What are the limitations?
Report Question 2
Let's consider how 'level' this track really is. Using uncertainty analysis, what is the uncertainty in the angle measurement of the track? Based on this uncertainty, our tracks are probably not exactly at $\theta = 0.000...$. In an ideal physics set up, even a very small angle $\theta$ should create an acceleration. So, why can you get the car to stand still? (here are some tips on uncertainties: Error Analysis)
Report Question 3
Based on this angle, estimate the static (or rolling) friction coefficient that is acting on the car when it's on the ramp. The mass of the cart is ~ 500 grams.
Report Question 4
Your task is to obtain a value for $g$ based on the measurements. You'll need to know the angle for each run so make sure you've carefully noted that variable.
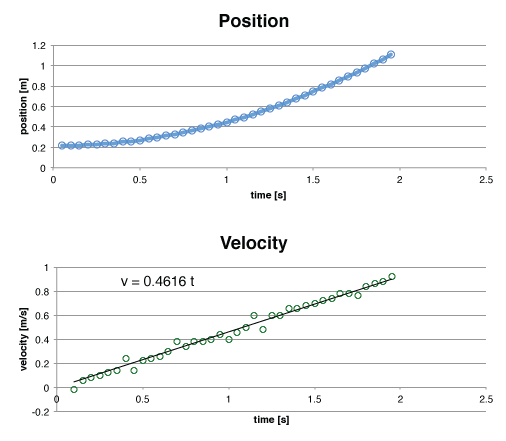
The procedure will be to import the position data into excel, then turn this data into a velocity vs. time graph, then find the slope of this v(t) graph, which will be the acceleration. Then use the $a = g \sin(\theta)$ relationship to obtain a value for $g$.
Remembering the kinematics relationships, the velocity of an object is given by the derivative of the position with respect to time. To do this in excel, you'll need to create a second column of data that contains the change in x over the $\Delta t$ between each data point. We'll let you figure that out on your own. If you're not even sure where to begin, here is a quick introduction.
Here is an example of what your graphs should look like.
For each angle, perform the analysis separately. Do the three measurements all produce similar results for $g$? Why or why not? Comment on reasons why they might be different.
Some tips:
- The equation for velocity as we learned in kinematics is $v(t) = v_0 + a t$. When you fit the velocity graph to obtain an acceleration constant, make sure you set the y intercept = 0, since there is no initial velocity (at t = 0, the velocity is 0). Depending on your data, you might need to offset your times so that the initial time value to zero. This can happen if your cart doesn't start moving at exactly t = 0. Or, you can fit your data to a linear line with a time offset: $v(t) = v_0 + a(t-t_0) = (v_0-at_0)+at$. The constant term in parenthesis can be determined by how long your offset from 0 was.
Report Question 5
Doing a similar analysis to this data as you did in the question above and determine the acceleration of the cart with and without the mass. Use your analysis to make a claim either that the mass affected the acceleration or that it did not. Would you expect it to based on our understanding of kinematics?
Report Question 6
More than likely, there are differences between some groups' estimation of $g$ shown in the table above. Comment on these discrepancies. If everyone had access to the same raw data (i.e. the video), shouldn't their results be the same? What could lead to variations in these results? Calculate the average value from $g$ based on these measurements. Is it within the uncertainty you would expect from the experiment?